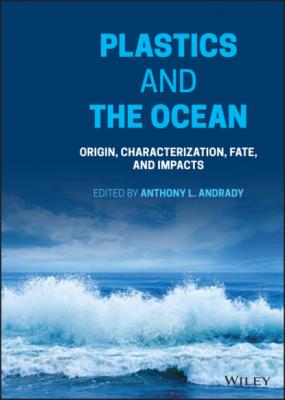
Plastics and the Ocean. Группа авторов
Читать онлайн.| Название | Plastics and the Ocean |
|---|---|
| Автор произведения | Группа авторов |
| Жанр | Химия |
| Серия | |
| Издательство | Химия |
| Год выпуска | 0 |
| isbn | 9781119768418 |
3 Chapter 3Figure 3.1 Schematic overview of three methodological approaches to identify...Figure 3.2 A visualization of a material flow analysis for plastics from pro...Figure 3.3 Illustration of a plastic bottle which can be identified when lit...Figure 3.4 The scientific field of plastic pollution research and potential ...
4 Chapter 4Figure 4.1 The schematics of chemical digestion and MP isolation from marine...Figure 4.2 Schematic representation of a hyperspectral image.Figure 4.3 Simplified schematic diagram of common FTIR analysis modes.Figure 4.4 Comparison of transmission and ATR techniques based on FTIR spect...Figure 4.5 Principal component analysis score plot of eight plastics.Figure 4.6 ATR‐FTIR spectral profiles of the commonly used plastics.Figure 4.7 Raman spectra of polyethylene and poly(tetrafluoroethylene) plast...Figure 4.8 Comparison of some commonly used techniques in terms of precision...
5 Chapter 5Figure 5.1 Geolocation of sampled water columns for MPs research (a). Sampli...
6 Chapter 6Figure 6.1 Natural processes affecting the distribution and fate of micropla...Figure 6.2 An overview of experiments on seafloor litter and sediment microp...Figure 6.3 (a) Fishing buoy (Celtic Sea, 2015, 113 m). (b) Barrel collected ...Figure 6.4 Diversity of organisms settled on various litter types collected ...
7 Chapter 7Figure 7.1 Commonly reported steps to monitor different sizes of plastics in...Figure 7.2 Global observational efforts by the number of studies for the mon...Figure 7.3 Illustration of sources and main processes influencing the transp...
8 Chapter 8Figure 8.1 Agents that bring about degradation and fragmentation of plastics...Figure 8.2 Spectral power distributions of the ASTM G173‐03 standard (AM 1.5...Figure 8.3 Comparison of the spectral features of a mercury vapor lamp with ...Figure 8.4 (Left) Transmittance spectra for several cut‐on filters. (Right) ...Figure 8.5 Photo‐oxidation of polyolefins illustrating the autocatalytic nat...Figure 8.6 (Left) Evolution of the carbonyl band in FTIR spectra of the LDPE...Figure 8.7 Summary of agents and effects associated with weathering of plast...Figure 8.8 Factors that control the mechanism and kinetics of photodegradati...Figure 8.9 Change in the average number‐average molecular weight Mn (g/mol),...Figure 8.10 (Left) Two‐stage macro‐fragmentation model for plastic objects e...Figure 8.11 A schematic of fragmentation by surface ablation. (Left) A spher...Figure 8.12 Micrographs showing irregular surface features of 0.1 μm po...
9 Chapter 9Figure 9.1 Summary of organic pollutants and metal ions reported to be sorbe...Figure 9.2 MPs studied in literature.Figure 9.3 Influence of properties of MPs on the sorption of pollutants.Figure 9.4 Sorption isotherms of pollutants onto MPs based on published lite...Figure 9.5 Sorption kinetics of pollutants by MPs.Figure 9.6 Sorption mechanisms of pollutants by MPs.
10 Chapter 10Figure 10.1 Consistency in the Plastisphere: (a) bacteria, diatoms, and (b) ...Figure 10.2 Diatom biofilm covering the surface of glass submerged in the ma...Figure 10.3 (a) A single diatom attached to the surface of a piece of plasti...Figure 10.4 Scanning electron microscopy images showing associations between...Figure 10.5 Bacterial community structure on plastic marine debris (polyethy...Figure 10.6 “Plastic tides” of biobeads from sewage treatment overflow in th...
11 Chapter 11Figure 11.1 Schematic representation of the two‐step biodegradation process ...Figure 11.2 An illustration of the biodegradation process of a semi‐crystall...Figure 11.3 Left: Inverse dependence of enzymatic biodegradation rate (mg we...Figure 11.4 Comparison of respirometric data from rapidly biodegrading polye...Figure 11.5 Left: Biometer flask with substrate in marine sediment. Right: F...
12 Chapter 12Figure 12.1 The number of articles published (stated above the bars) over th...Figure 12.2 Factors influencing the bioavailability of microplastics to mari...
13 Chapter 13Figure 13.1 Potential routes for microplastics to enter seafood throughout t...
14 Chapter 14Figure 14.1 Weathering of macroplastics leads to production of secondary mic...Figure 14.2 Nanoplastics may exist in the environment as (a) temporary free/...Figure 14.3 Nanoplastics develop a corona of proteins and other materials up...
Guide
6 Preface
7 Foreword
10 Index
11 WILEY END USER LICENSE AGREEMENT
Pages
1 iii
2 iv
3 v
4 ix
5 x
6 xi
7 xiii
8 xiv
9 xv
10 xvii
11 xviii
12 xix
13 xx
