Математика
Различные книги в жанре МатематикаFinancial Risk Modelling and Portfolio Optimization with R

Financial Risk Modelling and Portfolio Optimization with R, 2nd Edition Bernhard Pfaff, Invesco Global Asset Allocation, Germany A must have text for risk modelling and portfolio optimization using R. This book introduces the latest techniques advocated for measuring financial market risk and portfolio optimization, and provides a plethora of R code examples that enable the reader to replicate the results featured throughout the book. This edition has been extensively revised to include new topics on risk surfaces and probabilistic utility optimization as well as an extended introduction to R language. Financial Risk Modelling and Portfolio Optimization with R: Demonstrates techniques in modelling financial risks and applying portfolio optimization techniques as well as recent advances in the field. Introduces stylized facts, loss function and risk measures, conditional and unconditional modelling of risk; extreme value theory, generalized hyperbolic distribution, volatility modelling and concepts for capturing dependencies. Explores portfolio risk concepts and optimization with risk constraints. Is accompanied by a supporting website featuring examples and case studies in R. Includes updated list of R packages for enabling the reader to replicate the results in the book. Graduate and postgraduate students in finance, economics, risk management as well as practitioners in finance and portfolio optimization will find this book beneficial. It also serves well as an accompanying text in computer-lab classes and is therefore suitable for self-study.
Presenting Data: How to Communicate Your Message Effectively
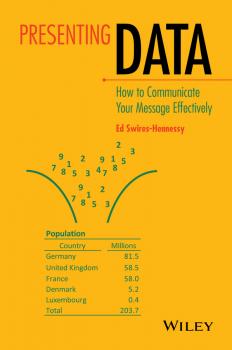
A clear easy-to-read guide to presenting your message using statistical data Poor presentation of data is everywhere; basic principles are forgotten or ignored. As a result, audiences are presented with confusing tables and charts that do not make immediate sense. This book is intended to be read by all who present data in any form. The author, a chartered statistician who has run many courses on the subject of data presentation, presents numerous examples alongside an explanation of how improvements can be made and basic principles to adopt. He advocates following four key ‘C’ words in all messages: Clear, Concise, Correct and Consistent. Following the principles in the book will lead to clearer, simpler and easier to understand messages which can then be assimilated faster. Anyone from student to researcher, journalist to policy adviser, charity worker to government statistician, will benefit from reading this book. More importantly, it will also benefit the recipients of the presented data. ‘Ed Swires-Hennessy, a recognised expert in the presentation of statistics, explains and clearly describes a set of “principles” of clear and objective statistical communication. This book should be required reading for all those who present statistics.’ Richard Laux, UK Statistics Authority ‘I think this is a fantastic book and hope everyone who presents data or statistics makes time to read it first.’ David Marder, Chief Media Adviser, Office for National Statistics, UK ‘Ed’s book makes his tried-and-tested material widely available to anyone concerned with understanding and presenting data. It is full of interesting insights, is highly practical and packed with sensible suggestions and nice ideas that you immediately want to try out.’ Dr Shirley Coleman, Principal Statistician, Industrial Statistics Research Unit, School of Mathematics and Statistics, Newcastle University, UK
Analysis of Poverty Data by Small Area Estimation

A comprehensive guide to implementing SAE methods for poverty studies and poverty mapping There is an increasingly urgent demand for poverty and living conditions data, in relation to local areas and/or subpopulations. Policy makers and stakeholders need indicators and maps of poverty and living conditions in order to formulate and implement policies, (re)distribute resources, and measure the effect of local policy actions. Small Area Estimation (SAE) plays a crucial role in producing statistically sound estimates for poverty mapping. This book offers a comprehensive source of information regarding the use of SAE methods adapted to these distinctive features of poverty data derived from surveys and administrative archives. The book covers the definition of poverty indicators, data collection and integration methods, the impact of sampling design, weighting and variance estimation, the issue of SAE modelling and robustness, the spatio-temporal modelling of poverty, and the SAE of the distribution function of income and inequalities. Examples of data analyses and applications are provided, and the book is supported by a website describing scripts written in SAS or R software, which accompany the majority of the presented methods. Key features: Presents a comprehensive review of SAE methods for poverty mapping Demonstrates the applications of SAE methods using real-life case studies Offers guidance on the use of routines and choice of websites from which to download them Analysis of Poverty Data by Small Area Estimation offers an introduction to advanced techniques from both a practical and a methodological perspective, and will prove an invaluable resource for researchers actively engaged in organizing, managing and conducting studies on poverty.
Foundations of Linear and Generalized Linear Models

A valuable overview of the most important ideas and results in statistical modeling Written by a highly-experienced author, Foundations of Linear and Generalized Linear Models is a clear and comprehensive guide to the key concepts and results of linearstatistical models. The book presents a broad, in-depth overview of the most commonly usedstatistical models by discussing the theory underlying the models, R software applications,and examples with crafted models to elucidate key ideas and promote practical modelbuilding. The book begins by illustrating the fundamentals of linear models, such as how the model-fitting projects the data onto a model vector subspace and how orthogonal decompositions of the data yield information about the effects of explanatory variables. Subsequently, the book covers the most popular generalized linear models, which include binomial and multinomial logistic regression for categorical data, and Poisson and negative binomial loglinear models for count data. Focusing on the theoretical underpinnings of these models, Foundations ofLinear and Generalized Linear Models also features: An introduction to quasi-likelihood methods that require weaker distributional assumptions, such as generalized estimating equation methods An overview of linear mixed models and generalized linear mixed models with random effects for clustered correlated data, Bayesian modeling, and extensions to handle problematic cases such as high dimensional problems Numerous examples that use R software for all text data analyses More than 400 exercises for readers to practice and extend the theory, methods, and data analysis A supplementary website with datasets for the examples and exercises An invaluable textbook for upper-undergraduate and graduate-level students in statistics and biostatistics courses, Foundations of Linear and Generalized Linear Models is also an excellent reference for practicing statisticians and biostatisticians, as well as anyone who is interested in learning about the most important statistical models for analyzing data.
Applied Univariate, Bivariate, and Multivariate Statistics

A clear and efficient balance between theory and application of statistical modeling techniques in the social and behavioral sciences Written as a general and accessible introduction, Applied Univariate, Bivariate, and Multivariate Statistics provides an overview of statistical modeling techniques used in fields in the social and behavioral sciences. Blending statistical theory and methodology, the book surveys both the technical and theoretical aspects of good data analysis. Featuring applied resources at various levels, the book includes statistical techniques such as t-tests and correlation as well as more advanced procedures such as MANOVA, factor analysis, and structural equation modeling. To promote a more in-depth interpretation of statistical techniques across the sciences, the book surveys some of the technical arguments underlying formulas and equations. Applied Univariate, Bivariate, and Multivariate Statistics also features Demonstrations of statistical techniques using software packages such as R and SPSS® Examples of hypothetical and real data with subsequent statistical analyses Historical and philosophical insights into many of the techniques used in modern social science A companion website that includes further instructional details, additional data sets, solutions to selected exercises, and multiple programming options An ideal textbook for courses in statistics and methodology at the upper- undergraduate and graduate-levels in psychology, political science, biology, sociology, education, economics, communications, law, and survey research, Applied Univariate, Bivariate, and Multivariate Statistics is also a useful reference for practitioners and researchers in their field of application. DANIEL J. DENIS, PhD, is Associate Professor of Quantitative Psychology at the University of Montana where he teaches courses in univariate and multivariate statistics. He has published a number of articles in peer-reviewed journals and has served as consultant to researchers and practitioners in a variety of fields.
High-Dimensional Covariance Estimation. With High-Dimensional Data

Methods for estimating sparse and large covariance matrices Covariance and correlation matrices play fundamental roles in every aspect of the analysis of multivariate data collected from a variety of fields including business and economics, health care, engineering, and environmental and physical sciences. High-Dimensional Covariance Estimation provides accessible and comprehensive coverage of the classical and modern approaches for estimating covariance matrices as well as their applications to the rapidly developing areas lying at the intersection of statistics and machine learning. Recently, the classical sample covariance methodologies have been modified and improved upon to meet the needs of statisticians and researchers dealing with large correlated datasets. High-Dimensional Covariance Estimation focuses on the methodologies based on shrinkage, thresholding, and penalized likelihood with applications to Gaussian graphical models, prediction, and mean-variance portfolio management. The book relies heavily on regression-based ideas and interpretations to connect and unify many existing methods and algorithms for the task. High-Dimensional Covariance Estimation features chapters on: Data, Sparsity, and Regularization Regularizing the Eigenstructure Banding, Tapering, and Thresholding Covariance Matrices Sparse Gaussian Graphical Models Multivariate Regression The book is an ideal resource for researchers in statistics, mathematics, business and economics, computer sciences, and engineering, as well as a useful text or supplement for graduate-level courses in multivariate analysis, covariance estimation, statistical learning, and high-dimensional data analysis.
Probability. With Applications and R

An introduction to probability at the undergraduate level Chance and randomness are encountered on a daily basis. Authored by a highly qualified professor in the field, Probability: With Applications and R delves into the theories and applications essential to obtaining a thorough understanding of probability. With real-life examples and thoughtful exercises from fields as diverse as biology, computer science, cryptology, ecology, public health, and sports, the book is accessible for a variety of readers. The book’s emphasis on simulation through the use of the popular R software language clarifies and illustrates key computational and theoretical results. Probability: With Applications and R helps readers develop problem-solving skills and delivers an appropriate mix of theory and application. The book includes: Chapters covering first principles, conditional probability, independent trials, random variables, discrete distributions, continuous probability, continuous distributions, conditional distribution, and limits An early introduction to random variables and Monte Carlo simulation and an emphasis on conditional probability, conditioning, and developing probabilistic intuition An R tutorial with example script files Many classic and historical problems of probability as well as nontraditional material, such as Benford’s law, power-law distributions, and Bayesian statistics A topics section with suitable material for projects and explorations, such as random walk on graphs, Markov chains, and Markov chain Monte Carlo Chapter-by-chapter summaries and hundreds of practical exercises Probability: With Applications and R is an ideal text for a beginning course in probability at the undergraduate level.
Multivariate Density Estimation. Theory, Practice, and Visualization

Clarifies modern data analysis through nonparametric density estimation for a complete working knowledge of the theory and methods Featuring a thoroughly revised presentation, Multivariate Density Estimation: Theory, Practice, and Visualization, Second Edition maintains an intuitive approach to the underlying methodology and supporting theory of density estimation. Including new material and updated research in each chapter, the Second Edition presents additional clarification of theoretical opportunities, new algorithms, and up-to-date coverage of the unique challenges presented in the field of data analysis. The new edition focuses on the various density estimation techniques and methods that can be used in the field of big data. Defining optimal nonparametric estimators, the Second Edition demonstrates the density estimation tools to use when dealing with various multivariate structures in univariate, bivariate, trivariate, and quadrivariate data analysis. Continuing to illustrate the major concepts in the context of the classical histogram, Multivariate Density Estimation: Theory, Practice, and Visualization, Second Edition also features: Over 150 updated figures to clarify theoretical results and to show analyses of real data sets An updated presentation of graphic visualization using computer software such as R A clear discussion of selections of important research during the past decade, including mixture estimation, robust parametric modeling algorithms, and clustering More than 130 problems to help readers reinforce the main concepts and ideas presented Boxed theorems and results allowing easy identification of crucial ideas Figures in color in the digital versions of the book A website with related data sets Multivariate Density Estimation: Theory, Practice, and Visualization, Second Edition is an ideal reference for theoretical and applied statisticians, practicing engineers, as well as readers interested in the theoretical aspects of nonparametric estimation and the application of these methods to multivariate data. The Second Edition is also useful as a textbook for introductory courses in kernel statistics, smoothing, advanced computational statistics, and general forms of statistical distributions.
i-Smooth Analysis. Theory and Applications

The edition introduces a new class of invariant derivatives and shows their relationships with other derivatives, such as the Sobolev generalized derivative and the generalized derivative of the distribution theory. This is a new direction in mathematics. i-Smooth analysis is the branch of functional analysis that considers the theory and applications of the invariant derivatives of functions and functionals. The important direction of i-smooth analysis is the investigation of the relation of invariant derivatives with the Sobolev generalized derivative and the generalized derivative of distribution theory. Until now, i-smooth analysis has been developed mainly to apply to the theory of functional differential equations, and the goal of this book is to present i-smooth analysis as a branch of functional analysis. The notion of the invariant derivative (i-derivative) of nonlinear functionals has been introduced in mathematics, and this in turn developed the corresponding i-smooth calculus of functionals and showed that for linear continuous functionals the invariant derivative coincides with the generalized derivative of the distribution theory. This book intends to introduce this theory to the general mathematics, engineering, and physicist communities.
Growth Curve Modeling. Theory and Applications
Features recent trends and advances in the theory and techniques used to accurately measure and model growth Growth Curve Modeling: Theory and Applications features an accessible introduction to growth curve modeling and addresses how to monitor the change in variables over time since there is no “one size fits all” approach to growth measurement. A review of the requisite mathematics for growth modeling and the statistical techniques needed for estimating growth models are provided, and an overview of popular growth curves, such as linear, logarithmic, reciprocal, logistic, Gompertz, Weibull, negative exponential, and log-logistic, among others, is included. In addition, the book discusses key application areas including economic, plant, population, forest, and firm growth and is suitable as a resource for assessing recent growth modeling trends in the medical field. SAS® is utilized throughout to analyze and model growth curves, aiding readers in estimating specialized growth rates and curves. Including derivations of virtually all of the major growth curves and models, Growth Curve Modeling: Theory and Applications also features: • Statistical distribution analysis as it pertains to growth modeling • Trend estimations • Dynamic site equations obtained from growth models • Nonlinear regression • Yield-density curves • Nonlinear mixed effects models for repeated measurements data Growth Curve Modeling: Theory and Applications is an excellent resource for statisticians, public health analysts, biologists, botanists, economists, and demographers who require a modern review of statistical methods for modeling growth curves and analyzing longitudinal data. The book is also useful for upper-undergraduate and graduate courses on growth modeling.