Joseph Schmuller
Список книг автора Joseph SchmullerStatistical Analysis with Excel For Dummies
You too can understand the statistics of life, even if you're math-challenged! What do you need to calculate? Manufacturing output? A curve for test scores? Sports stats? You and Excel can do it, and this non-intimidating guide shows you how. It demystifies the different types of statistics, how Excel functions and formulas work, the meaning of means and medians, how to interpret your figures, and more – in plain English. Getting there – learn how variables, samples, and probability are used to get the information you want Excel tricks – find out what's built into the program to help you work with Excel formulas Playing with worksheets – get acquainted with the worksheet functions for each step Graphic displays – present your data as pie graphs, bar graphs, line graphs, or scatter plots What's normal? – understand normal distribution and probability Hyping hypotheses – learn to use hypothesis testing with means and variables When regression is progress – discover when and how to use regression for forecasting What are the odds – work with probability, random variables, and binomial distribution Open the book and find: Ten statistical and graphical tips and traps The difference between descriptive and inferential statistics Why graphs are good How to measure variations What standard scores are and why they're used When to use two-sample hypothesis testing How to use correlations Different ways of working with probability
Statistical Analysis with Excel For Dummies
Take the mystery out of statistical terms and put Excel to work! If you need to create and interpret statistics in business or classroom settings, this easy-to-use guide is just what you need. It shows you how to use Excel's powerful tools for statistical analysis, even if you've never taken a course in statistics. Learn the meaning of terms like mean and median, margin of error, standard deviation, and permutations, and discover how to interpret the statistics of everyday life. You'll learn to use Excel formulas, charts, PivotTables, and other tools to make sense of everything from sports stats to medical correlations. Statistics have a reputation for being challenging and math-intensive; this friendly guide makes statistical analysis with Excel easy to understand Explains how to use Excel to crunch numbers and interpret the statistics of everyday life: sales figures, gambling odds, sports stats, a grading curve, and much more Covers formulas and functions, charts and PivotTables, samples and normal distributions, probabilities and related distributions, trends, and correlations Clarifies statistical terms such as median vs. mean, margin of error, standard deviation, correlations, and permutations Statistical Analysis with Excel For Dummies, 3rd Edition helps you make sense of statistics and use Excel's statistical analysis tools in your daily life.
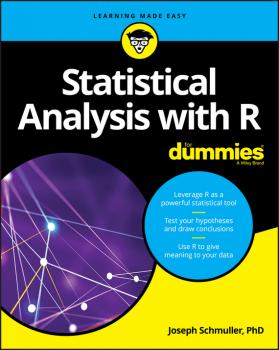
Statistical Analysis with R For Dummies
Understanding the world of R programming and analysis has never been easier Most guides to R, whether books or online, focus on R functions and procedures. But now, thanks to Statistical Analysis with R For Dummies, you have access to a trusted, easy-to-follow guide that focuses on the foundational statistical concepts that R addresses—as well as step-by-step guidance that shows you exactly how to implement them using R programming. People are becoming more aware of R every day as major institutions are adopting it as a standard. Part of its appeal is that it's a free tool that's taking the place of costly statistical software packages that sometimes take an inordinate amount of time to learn. Plus, R enables a user to carry out complex statistical analyses by simply entering a few commands, making sophisticated analyses available and understandable to a wide audience. Statistical Analysis with R For Dummies enables you to perform these analyses and to fully understand their implications and results. Gets you up to speed on the #1 analytics/data science software tool Demonstrates how to easily find, download, and use cutting-edge community-reviewed methods in statistics and predictive modeling Shows you how R offers intel from leading researchers in data science, free of charge Provides information on using R Studio to work with R Get ready to use R to crunch and analyze your data—the fast and easy way!
Statistical Analysis with Excel For Dummies
There's nothing random about it—this is the book on statistical analysis with Excel Stunned by statistics? Exhausted by Excel? Relax! Statistical Analysis with Excel For Dummies, 4th Edition shows you how to use the world's most popular spreadsheet program to crunch numbers and interpret statistics—even if you've never taken a statistics or advanced math course. In no time, you'll learn to use Excel to create and translate statistics in everyday life, understand common statistical terms, and improve your classroom or professional skills. Statistics has a reputation for being a challenging, math-intensive pursuit—but it doesn't have to make your palms sweat. Using a minimum of equations and assuming no prior knowledge of statistics or Excel, this hands-on guide cuts through the jargon and shows you how to make sense of formulas and functions, charts and PivotTables, samples and normal distributions, probabilities and related distributions, trends and correlations, and much more. Use Excel's tools to analyze and understand data Apply statistical analysis to predict trends and make decisions Interpret sales figures, gambling odds, and sports stats Develop a grading curve or medical correlations Forget the mumbo jumbo! This guide shows you that statistical analysis with Excel can be easy, fun, and useful!


